Invoice Portfolio Reporting Toolkit
Designed and built three browser-based dashboards that turn the factoring system's Excel exports into portfolio KPIs.
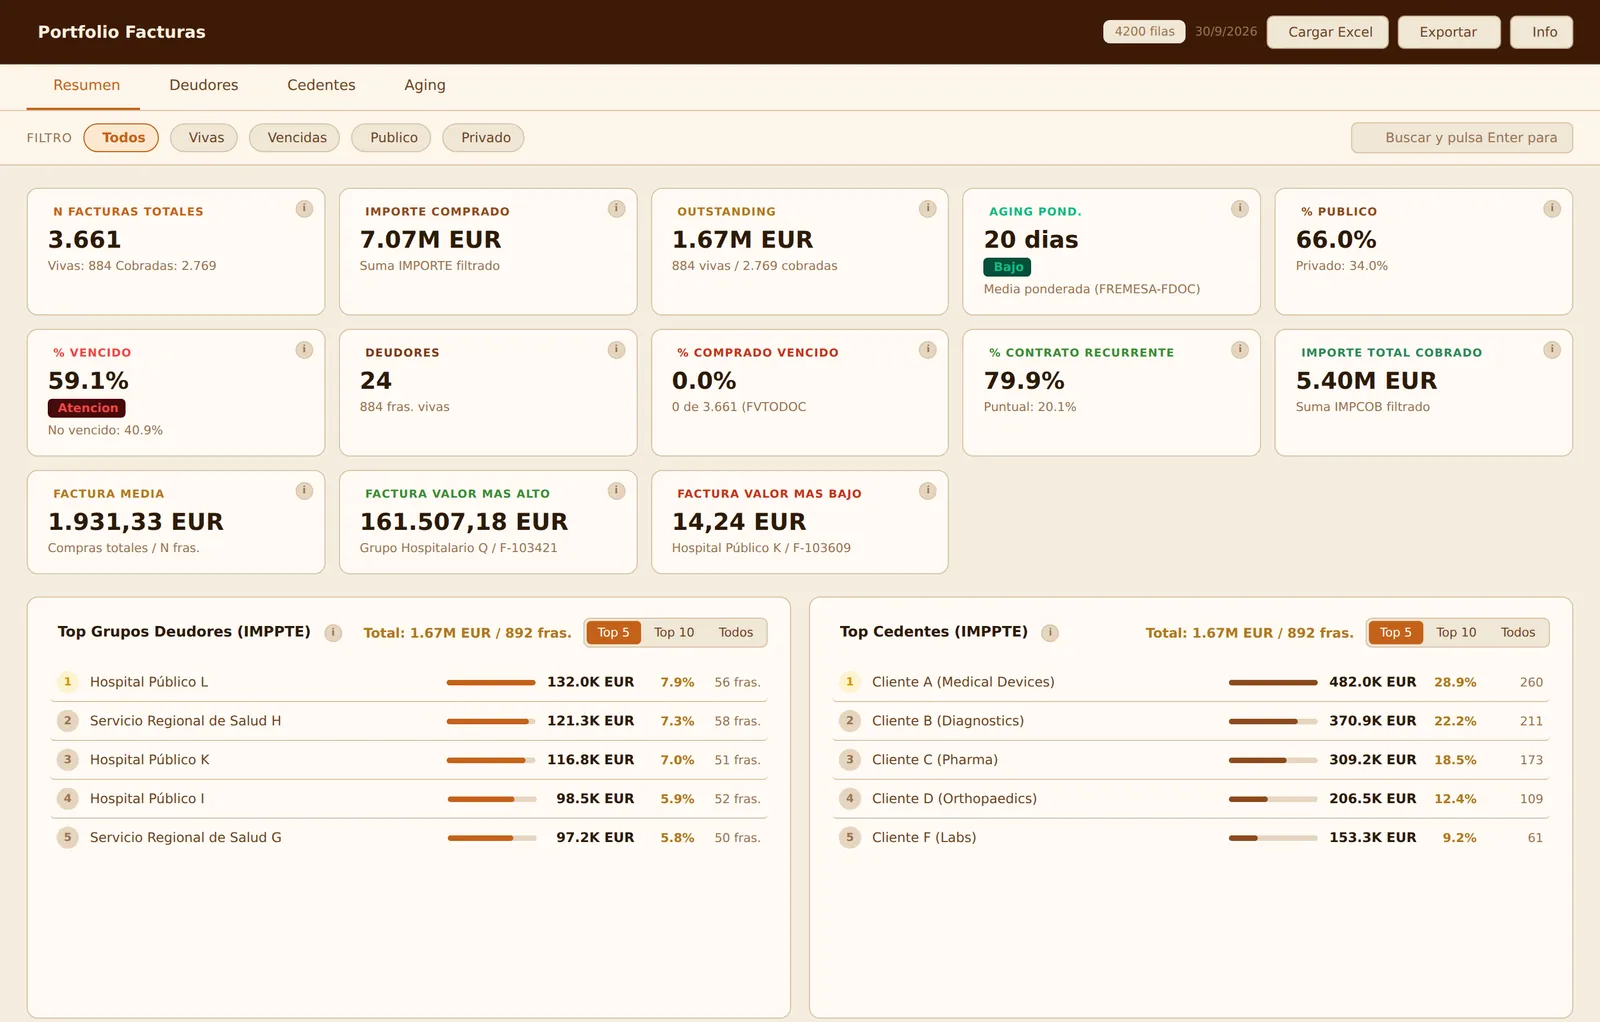 Screenshot of the real tool, invented data · click to enlarge
Context
Zintra Capital buys healthcare invoices from its clients. The active portfolio was €50–60M across 10,000+ invoices, and portfolio data came out of the system as Excel exports with 90+ columns.
Problem
Every portfolio question (what is outstanding, what is overdue, where the risk is concentrated, which invoices are stuck) meant filtering and pivoting those exports by hand. Unpaid invoices could not be identified reliably.
What I did
- Designed and built all three dashboards during my internship.
- Wrote the calculation rule for every KPI and documented it inside each tool.
- Built the filters and the exports to HTML, PDF and Excel.
Solution
- Portfolio KPI dashboard
- Outstanding vs collected, overdue share, concentration by debtor and client, and aging by bracket.
- Invoice incidents dashboard
- Groups incidents by type and follow-up action, with a debtor × incident matrix.
- Client financing panel
- Purchases, returns, collections and amounts pending financing, per client and month.
Each tool is a single HTML file that reads the export in the browser. No data is uploaded anywhere.
Try it: portfolio KPIs (invented data)
Result
- Management could see unpaid invoices clearly for the first time.
- Manual pivoting replaced by loading the latest export.
- ~5,000 lines of JavaScript, with every KPI definition documented in the tool.
Evidence
- Portfolio KPI dashboard: summary
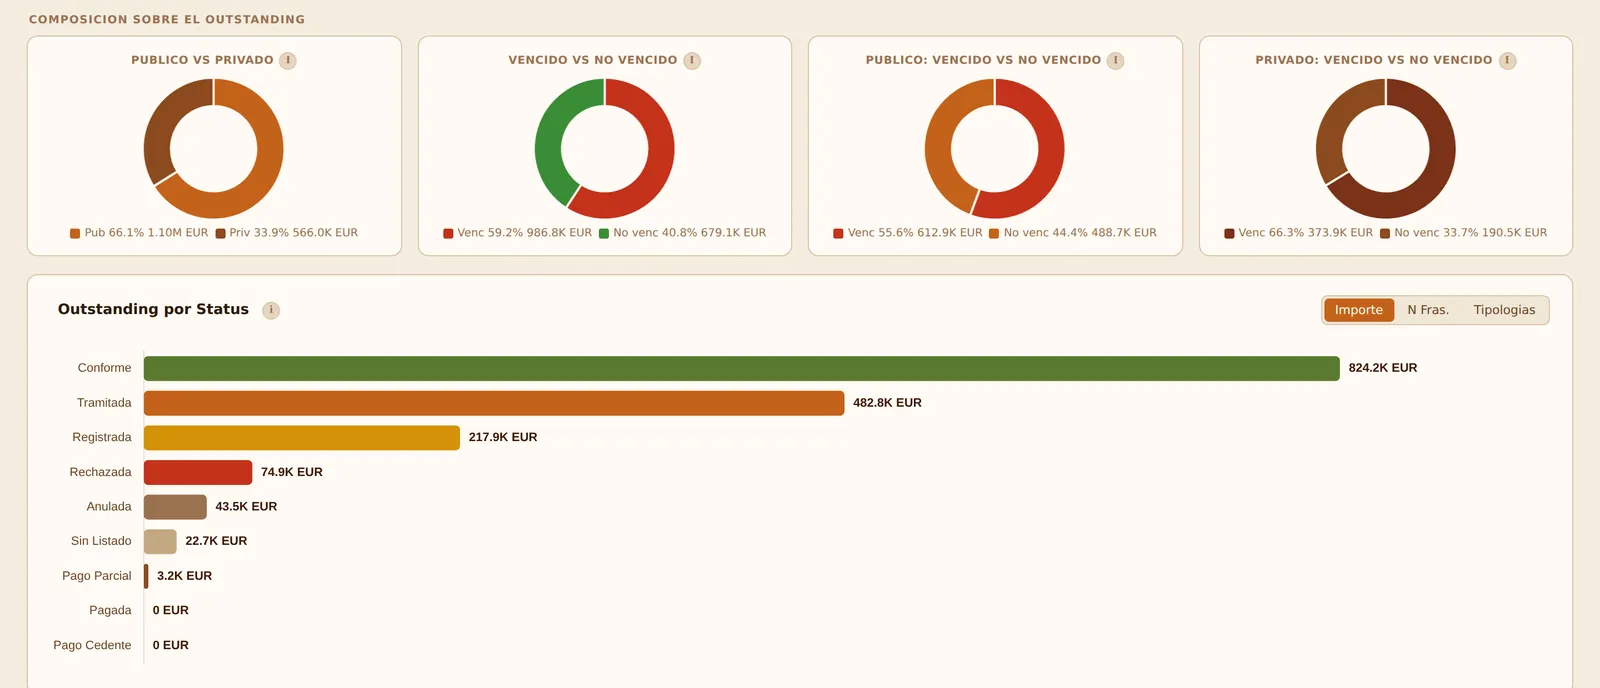 Portfolio KPI dashboard: composition
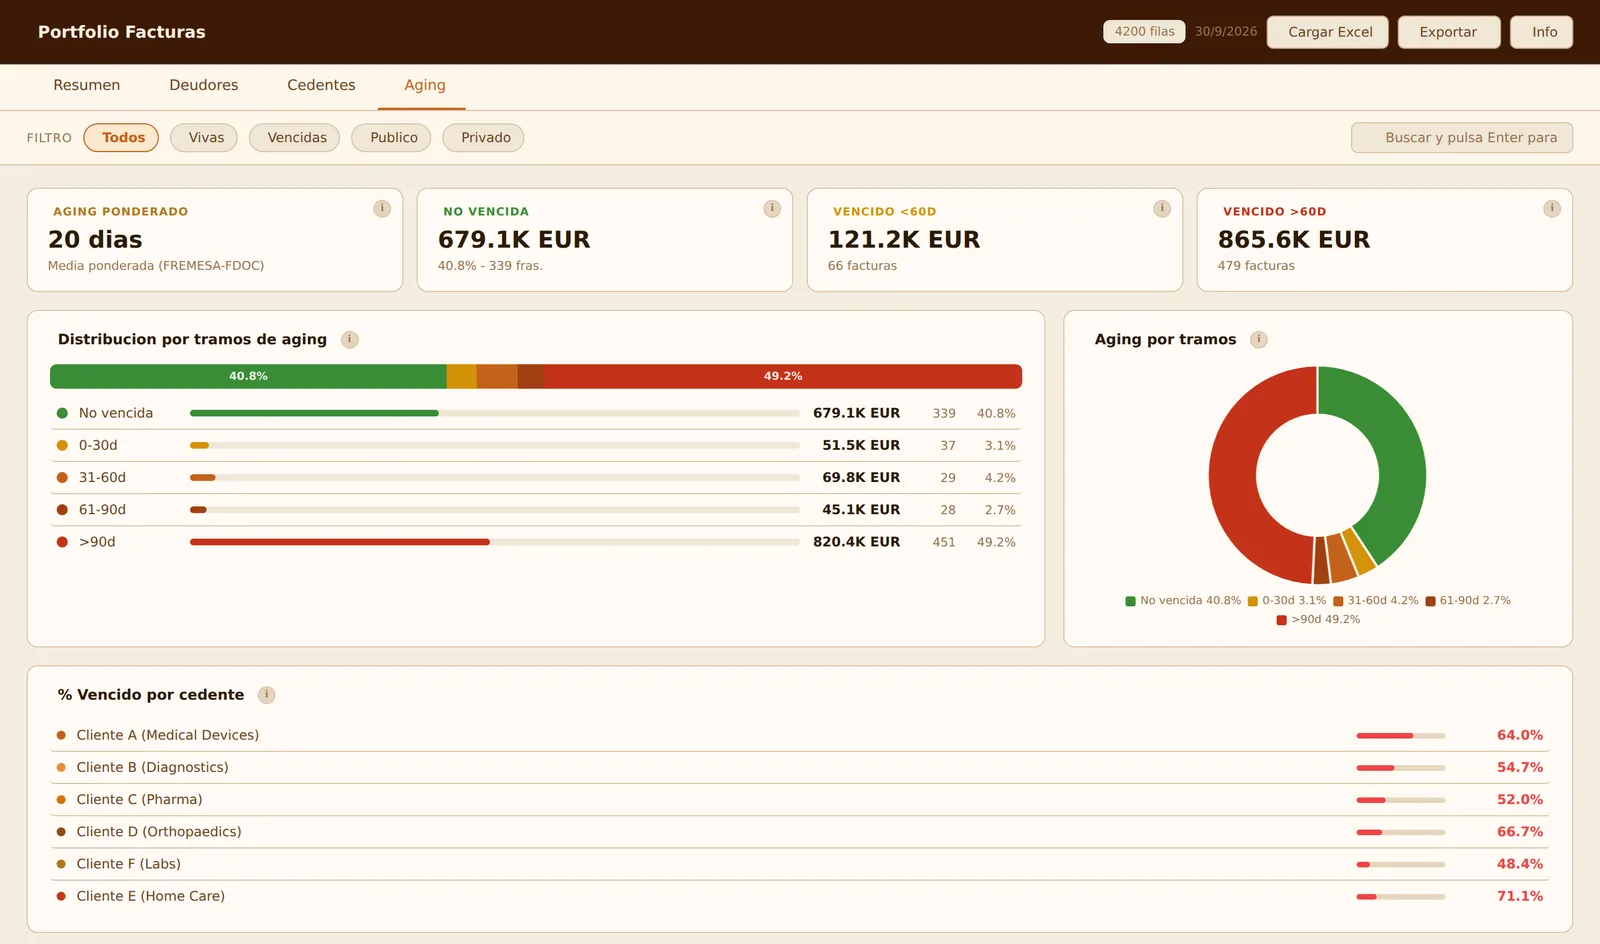 Portfolio KPI dashboard: aging
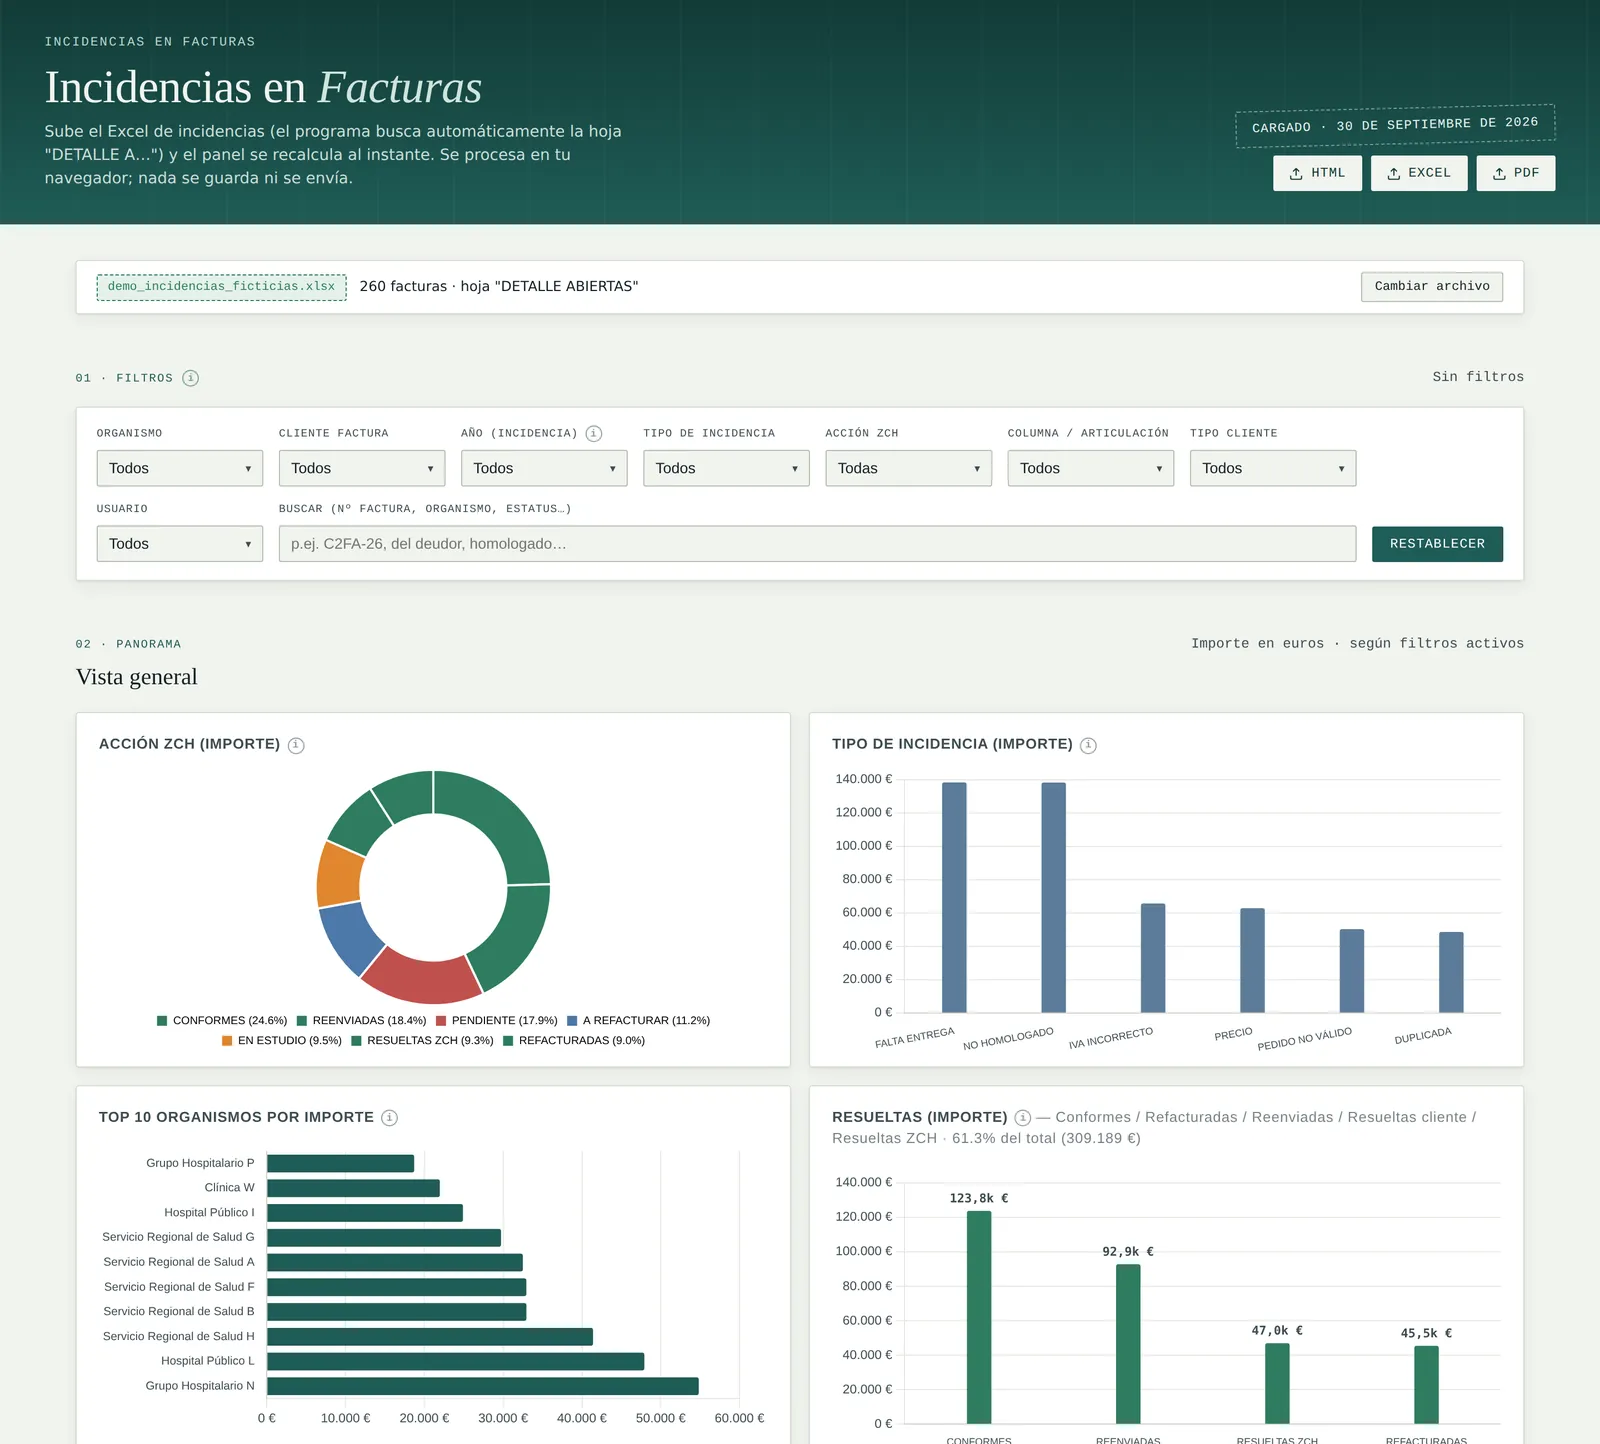 Invoice incidents dashboard: overview
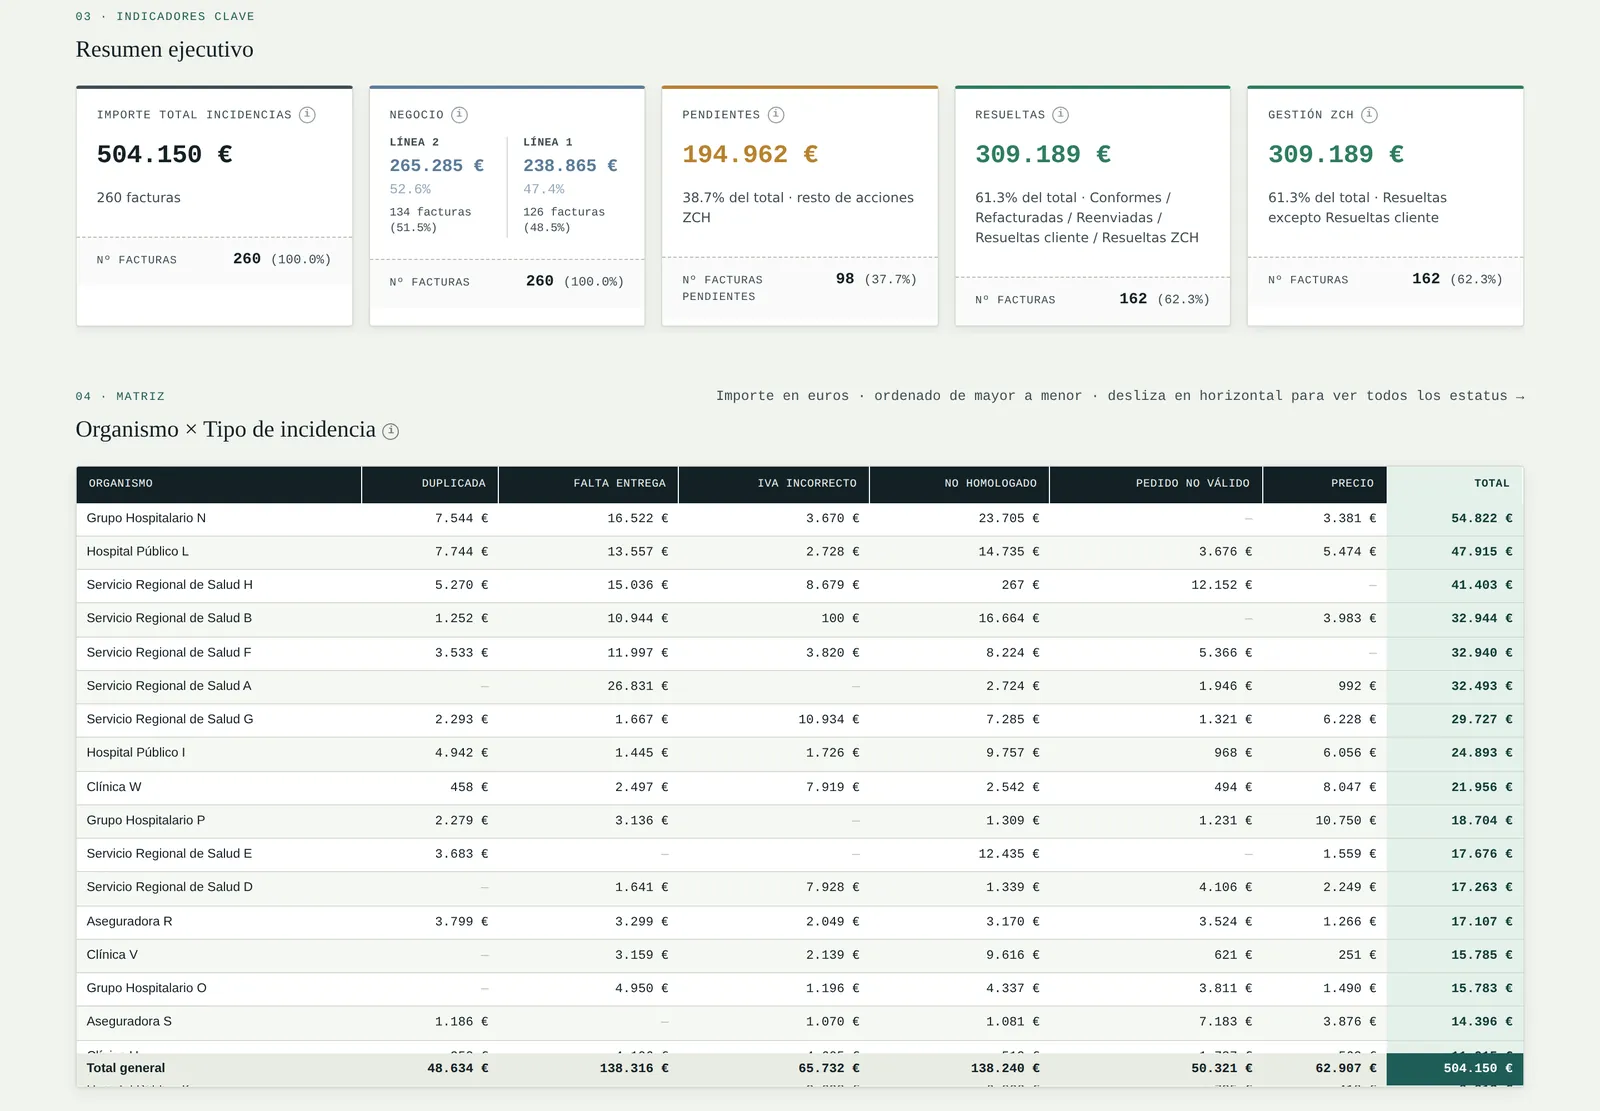 Invoice incidents dashboard: summary and matrix
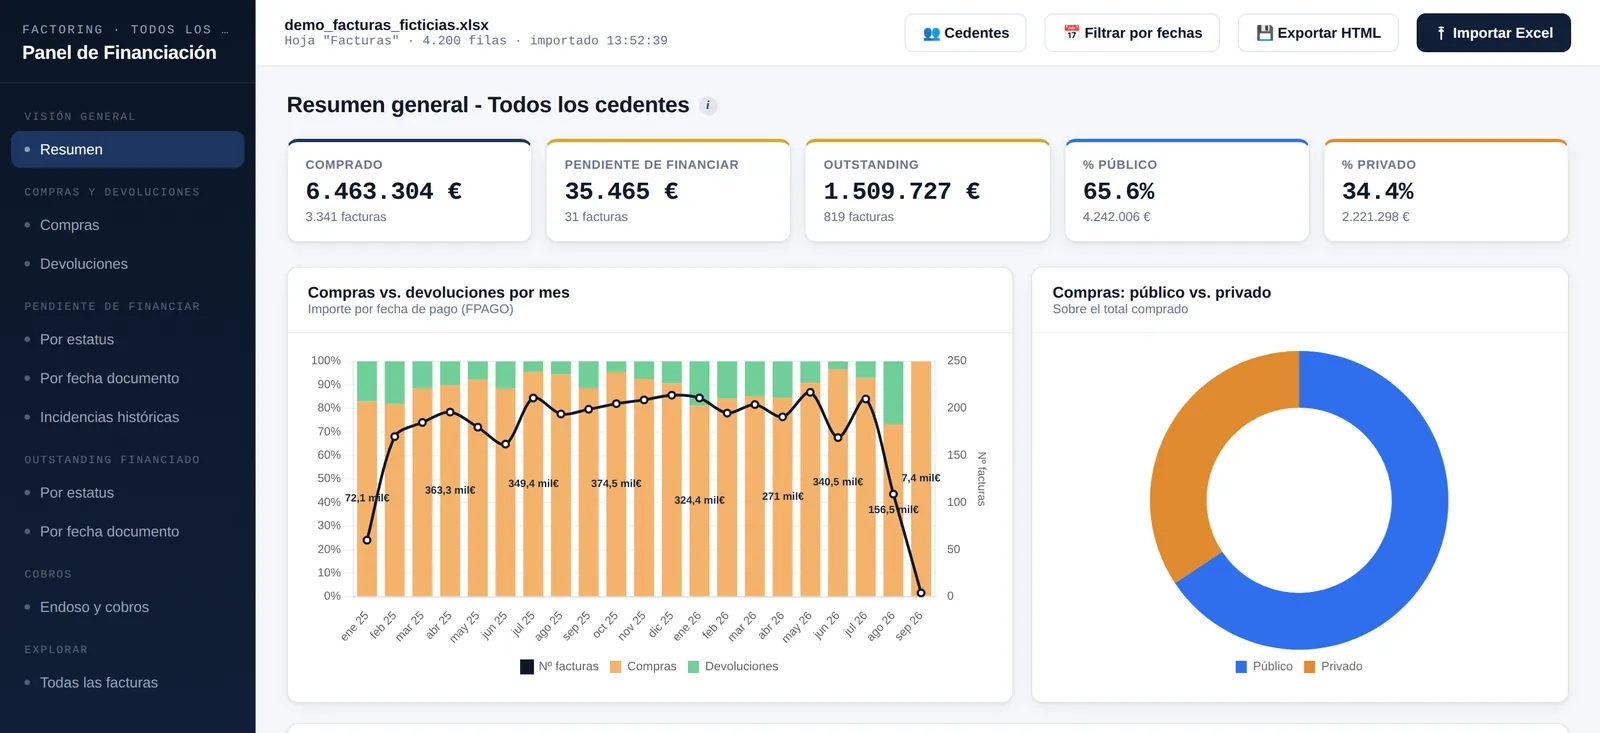 Client financing panel
View code: Aging by bracket and amount-weighted aging
From the Portfolio KPI dashboard. Aging per invoice = remittance date − document date; the portfolio KPI weights it by the outstanding amount.
// Aging per invoice: AGING = IF(FREMESA - FDOC = 0, 1, FREMESA - FDOC)
function calcAgingDias(r){
  var frem = r._fremesa, fdoc = r.FDOC ? new Date(r.FDOC) : null;
  if(!frem || !fdoc) return null;
  var d = Math.round((frem - fdoc) / 86400000);
  return d === 0 ? 1 : d;
}

function renderAging(rows, vivas){
  var ab = {'No vencida':0,'0-30d':0,'31-60d':0,'61-90d':0,'>90d':0};
  vivas.filter(r => r._imppte > 0 && r._fv).forEach(function(r){
    var d = (TODAY - r._fv) / 86400000;          // days past estimated due date
    var k = d<=0 ? 'No vencida' : d<=30 ? '0-30d' : d<=60 ? '31-60d' : d<=90 ? '61-90d' : '>90d';
    ab[k] += r._imppte;
  });
  // Weighted aging = Σ(aging × outstanding) ÷ Σ(outstanding)
  var w  = vivas.filter(r => r._imppte > 0 && r._agingdias != null);
  var sI = w.reduce((s, r) => s + r._imppte, 0);
  var sP = w.reduce((s, r) => s + r._agingdias * r._imppte, 0);
  var ag = sI ? sP / sI : 0;
  // … render KPI cards, bracket bars and doughnut
}
The production tools run on real company data and are not published. The screenshots show the same tools loaded with invented data.
Tools
JavaScript · HTML · Chart.js · SheetJS · ExcelJS · jsPDF · Excel